
A guide to the theory and practice of creating park factors, using ISO as an example.
Park factors are really just the worst.
I don’t mean in principle; the concept of adjusting player stats, either retrospectively for the sake of comparison or prospectively for the sake of projection, to account for the ballpark in which they play is a good idea. The problem lies in the math behind them. I’ve spent the better part of my free time for the last two or three weeks reading everything I could find written about park factors and adjustments, all the way from a post at Patriot’s old Tripod site to an article in an academic journal, and I’ve come to a few conclusions. First, it’s impossible to get park factors exactly correct. Second, it’s important to consider the tradeoffs you have to make if and when you decide to use a particular version. Third, there might be something wrong with me for spending so much time on this.
The basic idea behind calculating a park factor is easy enough, right? Usually in the context of runs per game (though sometimes by components like singles, HRs, etc), it’s a team’s production at home over production away. Boom. done.
Well, no, not really. That’s affected pretty heavily by the skill level of the team. Better include the opponents, too. So, for a given team, it’s that team’s production at home PLUS its opponents production in those games divided by that team’s production on the road PLUS its opponents productions in *those* games. There. That makes sense. Done.
Well, no, wait. What about interleague games? Adding/removing the DH from lineups will change the hitting skill level. We should probably exclude those. And what about pitchers batting? Given their lack of skill, will they be affected by a park the same way? Maybe we should leave their PAs out. And what about right- versus left-handers? It’s not like parks are symmetric across a line in center field, that probably makes a difference. And what about ground ball hitters versus fly ball hitters? They’ll be affected differently, too… but also, maybe the GB/FB ratio is affected by parks, too… You see my point, hopefully. This gets very complicated, very quickly, and all of the above is focused mostly on sample issues, not even really getting into problems with the formulas people use.
Still, for whatever foolish reasons drive any of us to dive headfirst into inconsequential things, I’ve decided on a method that I think makes sense, and will report on that here (and walk you through the creating of park factors for isolated power (ISO), the creation of which spurred this whole thing). As any thorough researcher would, I relied heavily on the works of those that came before me to teach me how to do this, and to give me a starting point from which to branch out. If you want to read more than I discuss here about the theories and calculations behind all this stuff, please see the following sites:
Patriot’s Park Factors
Baseball Reference Park Adjustments
FanGraphs Library - Park Factors
Park Factor Thoughts by TangoTiger
High Boskage - Baseball Data Normalization
Park Effects by Jim Furtado
The Philosophy of Park Factors by Colin Wyers:
Okay. Bearing all that in mind, and probably also some resources I forgot to mention, here's what I did to create park factors for isolated power. There's a LOT of methodological detail ahead, which I think some of you might want to see, but if you don't, I respect that - just skip to the results.
Using MySQL to query the Events table of my Retrosheet database (complete years only, so 1974-2013), I created a spreadsheet of year, home team, away team, batting team, league, at bats, handedness, and ISO. Using that information, for each home team I found the ISO (separated by batter handedness) of that team and that team's opponents. To each of these I applied a regression term, which I'll explain in the next paragraph. After making an adjustment to the opponents' number (that will be described later) I combined the two, proportionally weighting the opponents figure by how many opponents there were - so, say for Atlanta in 1974, the number is 1/12th Atlanta ISO, 11/12ths opponent ISO.
Regression, both in the above procedure and anywhere else I mention it, was based on the idea of reliability of statistics measured by Cronbach's alpha, which I was introduced to via Russell Carleton. He helped me out a bit when I was trying to figure it out, which I'm very grateful for. His articles on the subject can explain it much better than I ever could, so I direct you that way if you'd like to know more about it. I measured alpha separately for home and away ISO, using each season as an individual test subject while excluding the two strike years in the sample (as well as interleague and pitcher ABs). I truncated the seasonal data where necessary in order to make all years data lines equal length, and used the 'psy' package in R to actually calculate the alpha. For home teams, it came out to 0.668 in 1092 at bats for righties and 0.642 in 721 at bats for lefties; for away teams, it was 0.486 in 696 at bats and 0.467 in 405 at bats, respectively.
Since Cronbach's alpha is effectively a split-half correlation coefficient, I was able to use the value I found to determine how much regression should be included in my calculations based on the formula R = AB/(AB + X), where R is the alpha I found, AB is the number of at bats (per season) corresponding to the alpha, and X is the amount of at bats to use in regression. Note that AB is half of the actual number of at-bats used because of the split-half nature of Cronbach's alpha; I could have used the Spearman-Brown prophecy formula to get a predicted alpha for the entire set of at bats, but the math works out identically either way. Bottom line, for home right handers 271 ABs of league average ISO was added, for home lefties 200 ABs, for away righties 368 ABs, and for away lefties 231 ABs.
The adjustment to opponents' ISO I'd mentioned attempts to account for a sample difference across the different home teams. Weighting by quantity of opponents means that the batters contributing to the measured ISO will be evenly distributed across all league teams (or close to it, though not exactly even because of the unbalanced schedule); pitchers’ contributions, however, will then be coming disproportionately highly from the home team’s pitchers. To fix this problem, I decided to multiply the opponents’ ISO term by a term defined as the league average ISO allowed divided by the team’s pitchers’ regressed ISO allowed. There might be better ways to do this/solve this, and I’d love to hear them if there are, but this is what I went with for the results below.
That just about wraps up the home team term; now, on to the denominator of the equation. While many if not most park factors compare home production to away production, unless you have a very specific and more obscure goal for your park factors, this isn’t the correct way to do things. If a park factor is meant to remove any park effects and place a player in a theoretical league-average context, the point of comparison needs to be league average production, not away production. Now, the closer a park factor is to neutral the less this matters, since the distance of the road production from league average production must be 1/n the distance of the home production from average (because park factors must average out to neutral). If it were difficult to get the league average version, you could justify using away figures instead, but since it's very much *not* difficult, I used the league average. No further adjustments were needed; since regression is towards league average, none was included here, and using league average eliminated any over-representation from a single team in the sample.
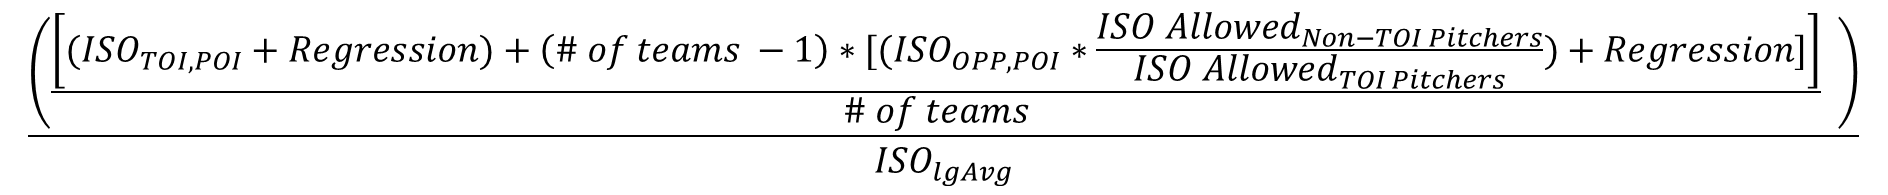
All of that gives you a raw park factor number. In theory, if you do this for all teams in a given year, they should average to 1. I found that this generally doesn't happen; I assume it's due to the regression and adjustments, but I can't say for sure. As the last step in the process I artificially and linearly adjust each factor to force the average in each league to be 1. The final equation comes out to the following (which looks even worse in Excel, trust me), where TOI is team of interest, OPP is that team’s opponents, and POI is park of interest:
At this linked spreadsheet, you can find single-year, three-year average, and five-year average park factors, both halved and unhalved, split by handedness for all teams and years since 1974. The averages are "surrounding"-year averages; that is to say, the year in question is the central point of the time period being averaged. Averages are interrupted by teams moving to new parks, but not by any configuration changes to existing parks.
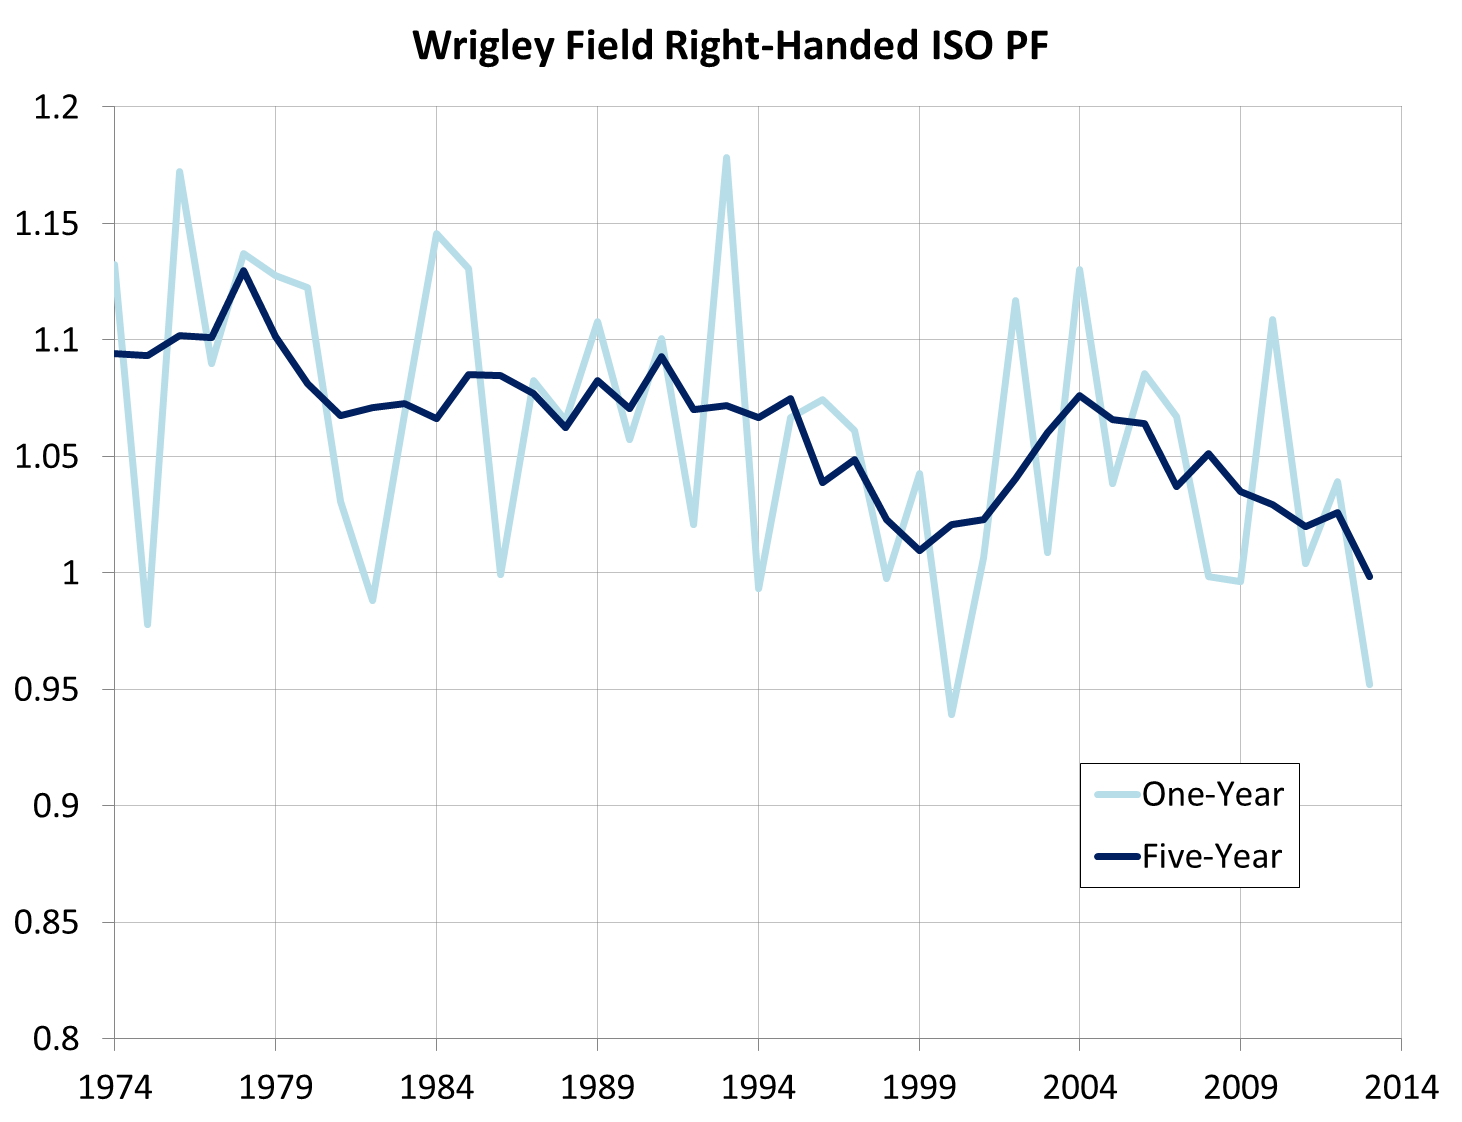
I personally find the most value in the single year numbers, but there are good arguments to be made for using averages. Single-year averages certainly appear to be noisier, but this is to be expected, and it's closer to being a feature than a bug. Part of that noise is due to a park "feature" that absolutely has an impact on the game, but gets lost if averaged factors are used: weather.Over the long term, the *climate* of a given city will be relatively stable, with changes happening over the course of many years; the *weather*, however, is much more variable season-to-season, and has a huge impact on batted balls, pitch movement, etc. Any park factor that's going to be applied to past data should account for that; hence, a single-year factor is best. Further, since the baseline is league average (and is hence affected by changes, in weather or anything else, in all league parks), it's to be expected that yearly numbers vary a bit.
Multi-years numbers definitely have their place as well, though. Anything forward-looking - say, a projection system - that wants to account for park effects would be better served in using multi-year park factors to estimate the adjustment that should be used. I didn't have the time to get the data on that, but it can be inferred from the following graphs, which show single-year, three-year, and five-year average park factors for Wrigley Field.

Throughout the above, ISO was my example; this is because wanting to create ISO+ (that is, league- and park-adjusted ISO) drove me to all of this in the first place. Not wanting to leave that idea hanging, below you can find both ISO and ISO+ for qualified batters in 2013. A quick glance through the data shows that the Pirates are helped out a lot, in terms of overall rank, by this method, with Andrew McCutchen and Neil Walker each jumping 17 spots. The Blue Jays are hurt (again, by ranking) a bit, with Jose Bautista and Adam Lind falling 7 and 8 spots, respectively. This is the most superficial of analyses, but maybe someone can find something more interesting.
| Name | Team | League | ISO | ISO+ |
|---|---|---|---|---|
| Chris Davis | BAL | AL | 0.347 | 217 |
| Miguel Cabrera | DET | AL | 0.288 | 195 |
| Brandon Moss | OAK | AL | 0.267 | 186 |
| Pedro Alvarez | PIT | NL | 0.240 | 183 |
| Paul Goldschmidt | ARI | NL | 0.249 | 176 |
| David Ortiz | BOS | AL | 0.255 | 171 |
| Edwin Encarnacion | TOR | AL | 0.262 | 166 |
| Mike Trout | ANA | AL | 0.234 | 163 |
| Evan Longoria | TBA | AL | 0.229 | 162 |
| Alfonso Soriano | - - - | - - - | 0.235 | 160 |
| Giancarlo Stanton | MIA | NL | 0.231 | 160 |
| Troy Tulowitzki | COL | NL | 0.229 | 157 |
| Mike Napoli | BOS | AL | 0.223 | 155 |
| Mark Trumbo | ANA | AL | 0.219 | 152 |
| Jose Bautista | TOR | AL | 0.239 | 152 |
| Marlon Byrd | - - - | NL | 0.220 | 150 |
| Domonic Brown | PHI | NL | 0.222 | 150 |
| Nate Schierholtz | CHN | NL | 0.218 | 149 |
| Carlos Gomez | MIL | NL | 0.222 | 148 |
| Jayson Werth | WAS | NL | 0.214 | 148 |
| Chris Carter | HOU | AL | 0.227 | 148 |
| Will Venable | SDN | NL | 0.216 | 147 |
| Andrew McCutchen | PIT | NL | 0.190 | 146 |
| Adam Dunn | CHA | AL | 0.223 | 145 |
| Jedd Gyorko | SDN | NL | 0.196 | 144 |
| Jay Bruce | CIN | NL | 0.216 | 144 |
| Carlos Beltran | SLN | NL | 0.195 | 142 |
| Hunter Pence | SFN | NL | 0.200 | 142 |
| Justin Upton | ATL | NL | 0.201 | 141 |
| Adam Jones | BAL | AL | 0.208 | 139 |
| Robinson Cano | NYA | AL | 0.202 | 139 |
| Yoenis Cespedes | OAK | AL | 0.203 | 139 |
| Matt Holliday | SLN | NL | 0.190 | 137 |
| Michael Cuddyer | COL | NL | 0.198 | 137 |
| Mitch Moreland | TEX | AL | 0.205 | 136 |
| Josh Donaldson | OAK | AL | 0.198 | 136 |
| Adrian Beltre | TEX | AL | 0.193 | 134 |
| Adam Lind | TOR | AL | 0.208 | 134 |
| Brandon Belt | SFN | NL | 0.192 | 134 |
| Ryan Zimmerman | WAS | NL | 0.191 | 132 |
| Chase Utley | PHI | NL | 0.191 | 129 |
| Freddie Freeman | ATL | NL | 0.182 | 129 |
| Dan Uggla | ATL | NL | 0.183 | 128 |
| Anthony Rizzo | CHN | NL | 0.187 | 128 |
| Coco Crisp | OAK | AL | 0.183 | 127 |
| Neil Walker | PIT | NL | 0.167 | 127 |
| Joey Votto | CIN | NL | 0.186 | 124 |
| Carlos Santana | CLE | AL | 0.186 | 124 |
| Starling Marte | PIT | NL | 0.161 | 123 |
| Josh Hamilton | ANA | AL | 0.182 | 123 |
| Adrian Gonzalez | LAN | NL | 0.168 | 122 |
| Matt Carpenter | SLN | NL | 0.163 | 120 |
| Adam LaRoche | WAS | NL | 0.166 | 120 |
| Ian Desmond | WAS | NL | 0.173 | 120 |
| Justin Smoak | SEA | AL | 0.174 | 119 |
| Shin-Soo Choo | CIN | NL | 0.178 | 119 |
| Nick Swisher | CLE | AL | 0.176 | 118 |
| Brian Dozier | MIN | AL | 0.170 | 118 |
| Jonathan Lucroy | MIL | NL | 0.175 | 117 |
| Matt Wieters | BAL | AL | 0.181 | 117 |
| Kendrys Morales | SEA | AL | 0.171 | 117 |
| Todd Frazier | CIN | NL | 0.173 | 116 |
| Mark Reynolds | - - - | NL | 0.172 | 115 |
| Russell Martin | PIT | NL | 0.151 | 115 |
| Desmond Jennings | TBA | AL | 0.162 | 114 |
| Yadier Molina | SLN | NL | 0.159 | 114 |
| J.J. Hardy | BAL | AL | 0.169 | 113 |
| Prince Fielder | DET | AL | 0.178 | 113 |
| Kyle Seager | SEA | AL | 0.166 | 111 |
| Jason Kipnis | CLE | AL | 0.169 | 110 |
| Andre Ethier | LAN | NL | 0.151 | 110 |
| Buster Posey | SFN | NL | 0.156 | 110 |
| Torii Hunter | DET | AL | 0.162 | 109 |
| Shane Victorino | BOS | AL | 0.157 | 108 |
| Jed Lowrie | OAK | AL | 0.156 | 108 |
| Asdrubal Cabrera | CLE | AL | 0.160 | 106 |
| Matt Dominguez | HOU | AL | 0.162 | 105 |
| Alex Rios | - - - | AL | 0.154 | 105 |
| Chase Headley | SDN | NL | 0.150 | 105 |
| Alex Gordon | KCA | AL | 0.157 | 104 |
| Andrelton Simmons | ATL | NL | 0.148 | 104 |
| Allen Craig | SLN | NL | 0.142 | 102 |
| A.J. Pierzynski | TEX | AL | 0.153 | 101 |
| Joe Mauer | MIN | AL | 0.153 | 100 |
| Justin Morneau | - - - | - - - | 0.151 | 100 |
| Manny Machado | BAL | AL | 0.148 | 99 |
| Ryan Doumit | MIN | AL | 0.149 | 99 |
| Brett Gardner | NYA | AL | 0.143 | 99 |
| Howie Kendrick | ANA | AL | 0.142 | 99 |
| Salvador Perez | KCA | AL | 0.141 | 98 |
| Austin Jackson | DET | AL | 0.145 | 98 |
| Eric Hosmer | KCA | AL | 0.146 | 97 |
| Pablo Sandoval | SFN | NL | 0.139 | 96 |
| Trevor Plouffe | MIN | AL | 0.139 | 96 |
| Daniel Nava | BOS | AL | 0.142 | 96 |
| Chris Johnson | ATL | NL | 0.136 | 96 |
| Martin Prado | ARI | NL | 0.134 | 95 |
| Nolan Arenado | COL | NL | 0.138 | 95 |
| Ian Kinsler | TEX | AL | 0.136 | 95 |
| Gerardo Parra | ARI | NL | 0.135 | 94 |
| Alejandro De Aza | CHA | AL | 0.142 | 92 |
| Brandon Phillips | CIN | NL | 0.136 | 91 |
| Daniel Murphy | NYN | NL | 0.129 | 90 |
| Nate McLouth | BAL | AL | 0.141 | 88 |
| Mike Moustakas | KCA | AL | 0.131 | 87 |
| Jean Segura | MIL | NL | 0.129 | 86 |
| Billy Butler | KCA | AL | 0.124 | 86 |
| Chris Denorfia | SDN | NL | 0.117 | 86 |
| Jacoby Ellsbury | BOS | AL | 0.128 | 86 |
| James Loney | TBA | AL | 0.131 | 85 |
| David Freese | SLN | NL | 0.119 | 85 |
| Ben Zobrist | TBA | AL | 0.128 | 85 |
| Zack Cozart | CIN | NL | 0.127 | 85 |
| Victor Martinez | DET | AL | 0.129 | 84 |
| Leonys Martin | TEX | AL | 0.125 | 82 |
| Brandon Crawford | SFN | NL | 0.114 | 80 |
| Dustin Pedroia | BOS | AL | 0.114 | 79 |
| Michael Young | - - - | NL | 0.116 | 78 |
| Yunel Escobar | TBA | AL | 0.110 | 78 |
| Alberto Callaspo | OAK | AL | 0.110 | 76 |
| Erick Aybar | ANA | AL | 0.111 | 76 |
| Paul Konerko | CHA | AL | 0.111 | 75 |
| Denard Span | WAS | NL | 0.102 | 73 |
| Michael Brantley | CLE | AL | 0.112 | 73 |
| Starlin Castro | CHN | NL | 0.102 | 73 |
| Jon Jay | SLN | NL | 0.095 | 70 |
| Darwin Barney | CHN | NL | 0.096 | 68 |
| Jimmy Rollins | PHI | NL | 0.097 | 65 |
| Alexei Ramirez | CHA | AL | 0.096 | 65 |
| Michael Bourn | CLE | AL | 0.097 | 64 |
| Eric Young | - - - | NL | 0.087 | 60 |
| Gregor Blanco | SFN | NL | 0.084 | 59 |
| Norichika Aoki | MIL | NL | 0.084 | 57 |
| Ichiro Suzuki | NYA | AL | 0.081 | 56 |
| Nick Markakis | BAL | AL | 0.085 | 53 |
| Jose Altuve | HOU | AL | 0.080 | 52 |
| Marco Scutaro | SFN | NL | 0.072 | 51 |
| Adeiny Hechavarria | MIA | NL | 0.071 | 50 |
| Alcides Escobar | KCA | AL | 0.066 | 46 |
| Elvis Andrus | TEX | AL | 0.060 | 42 |
Anyway, I hope someone out there found this all useful. I’d love any feedback or questions you might have, since I’m planning on doing this same process to establish (better) park factors for a bunch of different stats as prep work for a series of cross-era comparison articles coming somewhere down the line. For example, I thought about trying to account for schedule imbalance when I weighted opponents' ISO in the numerator, but it was difficult to accomplish in my spreadsheet and I guessed that the increase in accuracy wasn't worth the effort. If there's anything you notice, please let me know.
. . .
The information used here was obtained free of charge from and is copyrighted by Retrosheet. Interested parties may contact Retrosheet at www.retrosheet.org. Some other statistics courtesy of FanGraphs and Baseball-Reference.
John Choiniere is a researcher and featured (occasional) writer at Beyond the Box Score. You can follow him on Twitter at @johnchoiniere.