About a month ago, we looked at the magnitude of park and league effects on raw pitching statistics, including ERA, FIP, and xFIP. Along the same lines, I was interested in how much context may impact raw hitting stats. To determine the magnitude of park effects on hitting stats, I decided to compare Fangraphs wOBA (weighted on-base average, essentially a measure of overall offensive production) to Fangraphs wRC+ (a park- and league-adjusted measure of overall offensive production relative to league average, which is standardized to 100).
I used SigmaPlot to estimate the relationship between wOBA and wRC+ for all 2011 hitters with at least 200 plate appearances (R = 0.98, p < 0.001). For those unfamiliar with linear regression, the process places all players' wOBA and wRC+ into (x,y) space and then looks for the straight line that minimizes the distance between each of those points and the line (it's actually a bit more complex than that but for a one sentence explanation that should suffice). I called this line "park-adjusted wOBA" or "wOBA+" (see the image below):
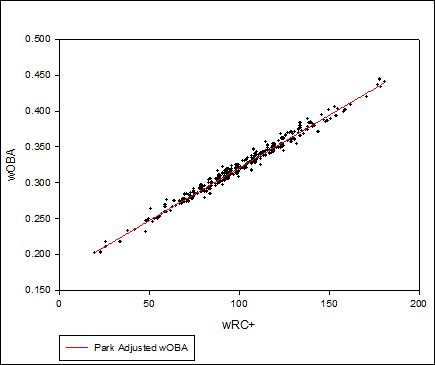
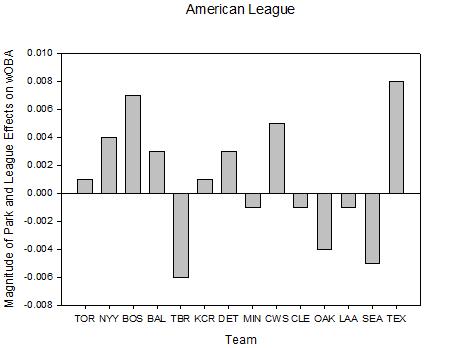
Next, based on the estimated relationship (wOBA+ = 0.1738 + 0.0015*wRC+) and each player's actual wOBA, I calculated the magnitude of each adjustment (Adjustment = wOBA+ - wOBA). I sorted by team and found the average adjustments to be as follows (first, the American League, then the National League):
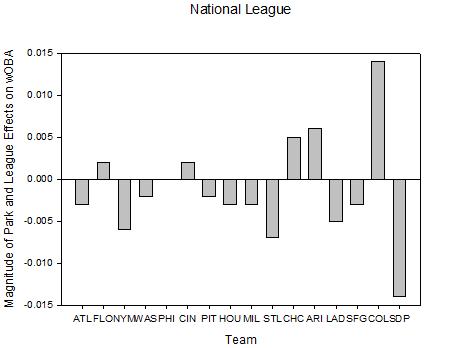
Of course, it's important to note that these league- and park-adjustments do not account for specific player attributes. Power hitters stand to gain the most from playing in hitter-friendly parks and may actually be slightly undersold by park-adjusted stats in pitcher-friendly parks. Conversely, park-adjusted statistics may assume that singles hitters who play in spacious ballparks would produce more than they actually would in neutral parks. Anyway, we all knew that Petco is pitcher-friendly and Coors is hitter-friendly but I would not have expected that a wOBA of .302 would be league-average in San Diego and a wOBA of .330 would be league average in Denver.
Finally, this is a Toronto Blue Jays blog after all, so note how the American League figure shows Toronto to be an essentially neutral hitting environment. Considering that pitching in Toronto causes a pitcher to yield roughly 0.20 earned runs per nine innings more than he would in a neutral run environment, it is interesting that it does not seem to help hitters. My guess is that this is just another hardship to chalk up to playing in the toughest division in baseball, what do you all think?