
One of the great things about baseball is its continued unpredictability in the face of so many advanced statistical forecasting efforts. In a particular game J.P. Arencibia might play the role of offensive hero while Edwin Encarnacion might wear a golden sombrero and look utterly lost at the plate. Adam Lind has been known to hit home runs off left handed pitching and Ryan Goins can come up and be a top notch player for a stretch, despite struggling to hit at the AAA level. In short, anything is possible. Of course, the larger the sample size becomes the less inexplicable the events become and over time Edwin will prove himself to be a far better hitter than J.P., Lind will uselessly flail away at lefties most of the time, and in all likelihood Ryan Goins is a Triple A player or utility man. Even so, there are plenty of times when the most advanced projection systems are way off as players or teams rise from the shadows or fall vastly below expectations. At the moment Chris Davis and Josh Donaldson are 4th and 5th in the major leagues in WAR, there's not a projection system that had that one in their preseason predictions, or should have for that matter.
The Blue Jays have both benefited enormously and been hurt immensely by the unpredictable nature of baseball in recent years. Jose Bautista and Edwin Encarnacion both became stars in their late twenties when there was no reason to believe that would be the case. Bautista projected to be a useful-ish utility man while Encarnacion was an interesting, but not inspiring bat, with serious defensive limitations. The core of this team's offense is based on breakouts that the front office couldn't possibly have predicted. On the flip side, the Blue Jays had a young, solid, cost effective starter in Ricky Romero who fell off the side of the earth. This year they added a pitcher who had ranged from amazing to above average his entire career, Josh Johnson, who then produced a career best 9.18 K/9 and a 3.59 xFIP but paired that with a 6.20 ERA and a 2-8 record (for those who care about that sort of thing). This has been a season where not a single major projection system saw Toronto as a below .500 team and many thought they were a playoff team. In the midst of all the chaotic unpredictability that has been the Toronto Blue Jays of late, especially in 2013, there has been a single beacon of stability and certainty: Mark Buehrle.
Although Mark Buehrle was not the most heralded addition to the Blue Jays from "The Trade" he was one that, despite a hefty price tag, Blue Jays fans felt fairly comfortable about. While there were some injured concerns about Josh Johnson and Jose Reyes, Mark Buehrle was Mr. Dependable. Buehrle pitched 200+ innings every year between 2001 and 2012. He has a career ERA of 3.82 and in his 12 seasons as a starter before this year he has been with 0.50 of that ERA in 10 of them. He has a career FIP of 4.13 and has similarly been within 0.50 of that mark in 10 of the 12 seasons between 2001 and 2012. This year, well on the way to extending his streak of 200 inning seasons, Mark Buehrle has been vintage Mark Buehrle (Disclaimer: all stats to follow are going into last night's nightmare start):
Time Period | ERA | FIP | xFIP | Groundball % | HR/FB | LOB% | BABIP | K/9 | BB/9 | HR/9 |
2013 | 3.88 | 3.97 | 4.06 | 45.6% | 10% | 74% | .294 | 6.17 | 2.28 | 0.97 |
Career | 3.82 | 4.13 | 4.20 | 45.5% | 9.9% | 72.6% | .290 | 5.18 | 2.05 | 1.01 |
Those numbers are pretty staggeringly similar. In fact, you might say that this is a victory for predictability and logic over all the chaos in baseball. It would be an overstatement, but you might say it. I don't know; I don't know you very well.
The problem is that in the midst of this order is one rather surprising anomaly. Sticking out like a sore thumb in the line above is the fact that Mark Buehrle's strikeout rate is well above his career average. If he were to maintain his 6.17 K/9 it would be a career high for his years as a starter. That would be a pretty rare feat for someone this far along in their career. The chart below shows a trend in Buerhle's strikeouts over the last four years.
Season | Age | Fastball Velocity | K/9 |
2010 | 31 | 86.0 mph | 4.24 |
2011 | 32 | 85.6 mph | 4.78 |
2012 | 33 | 85 mph | 5.56 |
2013 | 34 | 84.3 mph | 6.17 |
Getting older and losing ticks on your fastball is very rarely a recipe for more strikeouts, making this case fairly peculiar. However, there are a couple of factors in play here that mitigate these results. The first is the low starting point. Buehrle's 4.24 K/9 mark in 2010 is quite a bit below his career average so we can expect some regression to the mean right off the top. He did have only 4.43 K/9 in 2009 so at the time there was probably reason to expect his K's were coming down, but let's assume the 2010 was just an off year for Buehrle striking out batters.
If we make that assumption then 2011 was a bump back up to a more reasonable number. That brings us to 2012, which we can also sort of explain away. In 2012 Buehrle moved to the National League and perhaps that accounts for his leap forward in strikeouts. At this point a narrative is starting to come together to explain this course of events. It is based on two assumptions, which is inherently dangerous, but the assumptions are both fairly reasonable.
Even if we can explain what happened between 2010 and 2012 with some level of confidence, I would say a fairly low level of confidence, 2013 doesn't make any sense. In 2013 Buehrle returned to the American league to pitch in a division with three teams in the bottom half of the league in strikeout rate and three of the top four in wOBA. This is not an easier situation to pitch in; this is not an easier situation to accumulate strikeouts in and Buehrle is getting older and losing velocity. Yet he is still striking out more batters. We have a full blown mystery on our hands. I will grant that the mystery of why a 34 year old pitcher who has always been below average at striking out batters is becoming slightly less below average is not everyone's cup of tea, but it's my cup of tea so away we go.
The Mystery of Mark Buehrle's Rising Strikeout Rate
One of the easiest ways that one could attempt to address this mystery is by seeing if the culprit is context rather than any change in Buehrle. It is no secret that strikeout rates league wide are on the rise, so it's possible that this phenomenon is just a mirage caused by a changing context. However, a quick perusal of the raw data shows that this is not the case:
Season | Mark Buehrle's K/9 | League Wide K/9 (Starters) |
2010 | 4.24 | 6.77 |
2011 | 4.78 | 6.75 |
2012 | 5.56 | 7.14 |
2013 | 6.17 | 7.16 |
For those who prefer a most visual representation here's the same data on a graph:
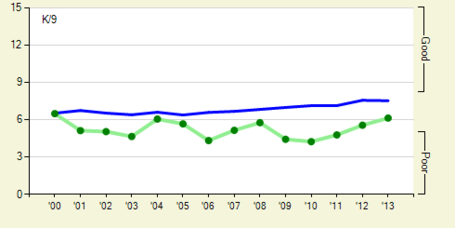
via FanGraphs
The MLB average in strikeouts is making a steady climb, but Buehrle is moving upwards at a much quicker rate. The league average for strikeouts by starting pitchers hasn't really moved since 2012 and Buerhle's strikeouts have increased despite entering a more difficult situation. The cause of this change is not the league wide pitching climate.
When trying to determine the source of new strikeouts my first inclination is to look at swinging strike rate. If a pitcher can miss bats it's more likely that they can strike batters out. The vast majority of strikeouts are swinging strikeouts so it seemed as good a place as any to start. Unfortunately, the results do not explain very much:
Time Period | Swinging Strike Percentage |
2010 | 6.1% |
2011 | 6.5% |
2012 | 7.3% |
2013 | 7.1% |
Career | 7.2% |
While it's true that Buehrle's swinging strike rate has been on the rise over the last four years it has never risen seriously above his career rate. His current swinging strike percentage is actually below his career average even though his K/9 is 0.99 higher.
If batters aren't swinging and missing more perhaps Buehrle is getting more called strikeouts. Called strikeouts aren't always considered a skill, although some pitchers like Vance Worley and Clay Bucholtz have demonstrated a consistent ability to get them. Whether one considers a spike in called strikeouts to be luck or skill based, it could account for Buehrle's rising strikeout rate. The only problem is that it doesn't:
Season | Called Strikeouts | Swinging Strikeouts | Total Strikeouts | Called Strikeout Percentage |
2010 | 32 | 67 | 99 | 32.3% |
2011 | 39 | 70 | 109 | 35.8% |
2012 | 37 | 88 | 125 | 29.6% |
2013 | 34 | 93 | 127 | 26.8% |
If anything Buehrle has been relying less and less on the called strikeout over the last couple of seasons. So we have a pitcher with his strikeouts going up without an increase in swinging strike percentage or called strikeouts. The whole thing is quite the quandary. If hitters aren't whiffing more against Buehrle and they aren't getting called out more then what is it?
The only remaining thing I could think of was that while overall whiffs remained similar to career norms, Buehrle might be getting more whiffs specifically in two strike counts.This explanation could make his increase in strikeouts to make sense. Thanks to Brooks Baseball it's possible to find out if that was the case:
Season | Two Strike Pitches | Two Strike Whiffs | Two Strike Whiff % |
2010 | 860 | 67 | 7.8% |
2011 | 771 | 70 | 9.1% |
2012 | 797 | 88 | 11.0% |
2013 | 789 | 93 | 11.8% |
It seems that over the last four years Buehrle has done a better and better job getting those whiffs exactly when they are needed most, with two strikes. Even though the difference between 2012 and 2013 isn't enormous we see that it amounts to five more strikeouts for Buehrle in fewer opportunities.
That in and of itself isn't an entirely satisfactory conclusion. We know that Buehrle is getting more two strike whiffs than ever, but we don't know how this is happening. To dig a little deeper I looked at pitch type data to see if there is any particular pitch that Buehrle is doing the damage with when he's gotten batters to two strikes. I've divided the pitches into the three categories used by Brooks Baseball: Hard, Breaking and Off-Speed. In Buehrle's case "Hard" (the quotation marks are especially appropriate in his case) pitches are fastballs and cutters, "Breaking" pitches are sliders and curveballs and "Off-Speed" pitches are changeups:
Season | Two Strike "Hard Pitches" Thrown | Whiffs on Two Strike "Hard" Pitches | Whiff% | Two Strike "Breaking" Pitches Thrown | Whiffs on Two Strike "Breaking" Pitches | Whiff% | Two Strike "Off-Speed" Pitches Thrown | Whiffs on Two Strike "Off-Speed" Pitches | Whiff% |
2010 | 558 | 37 | 6.6% | 68 | 6 | 8.8% | 234 | 24 | 10.3% |
2011 | 453 | 26 | 5.7% | 101 | 14 | 13.6% | 217 | 30 | 13.8% |
2012 | 418 | 29 | 6.9% | 91 | 17 | 18.7% | 290 | 42 | 14.5% |
2013 | 436 | 34 | 7.8% | 103 | 10 | 9.7% | 222 | 49 | 22.1% |
One interesting outlier here is Buehrle's success on breaking pitches in 2012, but given that it comes from the smallest sample size here and it's been fluctuating without any sort of pattern it's hard to make anything of it. Beyond the breaking balls what is truly of interest is Buehrle's increasing success getting batters to whiff on two strike changeups. This year Buerhle has made hitters strike out swinging against the pitch over twice as many times than in 2010 with 12 fewer pitches thrown. It's hard to be absolutely certain of these things, but it appears that Buehrle's ability to put hitters away with his changeup is the driving force behind his boost in strikeouts in 2013 despite his declining velocity and the fact he is pitching in the most difficult division he's ever pitched in.
Although I feel like the mystery is solved in a sense, I couldn't begin to tell you why Buehrle's changeup has been more effective this year with two strikes. Here are some of the properties of the pitch over the last four years that one would think might affect the success of the pitch:
Season | Changeup Velocity | Changeup Vertical Movement (inches) | Changeup Horizontal Movement (inches) |
2010 | 79.9 mph | 3.73 | 7.68 |
2011 | 78.8 mph | 4.29 | 7.96 |
2012 | 78.3 mph | 5.37 | 7.26 |
2013 | 78.6 mph | 4.27 | 7.56 |
That just looks like a big noisy mess. From there the trail pretty much runs cold. As far as I'm concerned that's OK.
Consider the premise of this post. On the surface, the most predictable and consistent player on the Blue Jays appears to be having the same season he has every single year. However, there is one exception. He is striking out more batters than ever, still fewer than average mind you, at an age and in a situation where that seems exceptionally unlikely. After a fairly in depth investigation of how this might be the case I come to the conclusion that this is due to more success than ever throwing his changeup with two strikes. However, there's nothing about his changeup that seems particularly different. The movement and velocity is basically the same. I didn't address this above (I figured by this point no one wants to see a bunch of pictures of the same thing) but he's still throwing it low and away to right handed batters, same as always. To summarize: Even the most predictable player can do an unpredictable thing and even if you can find out how it is coming about that's no guarantee you can figure out how he's doing it.
That kind of uncertainty can really get under your skin, and as someone who likes to explore the quantitative aspect of baseball sometimes it can be unrewarding to be unable to find the answers I seek. However, it's not realistic be able to find all the answers, nor should one want to. Baseball's foray into advanced statistical analysis is in many ways a war on uncertainty and a quest for knowledge, but without that same uncertainty the quest itself would be over. Once the map gets filled in there's not much work for explorers anymore. I enjoy that quest; both as a participant and as a consumer, and I wouldn't want it to end. For some, there could be nothing less interesting than why an old pitcher who has never been good at striking out batters is now slightly better at doing so. I absolutely understand that. For me, it's a blank spot on the map.