
According to Minor Leaguer's article, the Jays should sign Ubaldo Jimenez, who posted the 6th-best K-rates in the AL in 2013. However, Ubaldo's whiff-rates were only average. Is he likely to maintain a high K-rate in spite of middling whiff-rates? This article uses linear regression to determine whether a pitcher's K-rate can consistently exceed the K-rate predicted by his whiff-rate.
Earlier today, Minor Leaguer posted an article making the case for the Jays to sign free agent pitcher Ubaldo Jimenez. I'm not going to restate the case here because I think Minor Leaguer did a nice job of it already and if you're going to read my article or his, you should just read his. You should always just read his.
Ubaldo Jimenez and the Blue Jays
 Bluebird Banter writers were asked who they would pick if they could choose one free agent for the Blue Jays to sign. It is Minor Leaguer's turn and he chose starting pitcher Ubaldo Jimenez and outlines the reason why he thinks Jimenez presents good value for the Jays.
I will outline a few points that I do think are important to the case for signing Jimenez because we have to start somewhere and this is nice filler. After a lousy 2012, Jimenez bounced back nicely this season (April notwithstanding) and had a strong season no matter how you look at it (86 / 90 / 91 by ERA- / FIP- / xFIP-). Although Jimenez has lost a couple ticks (a ridiculous colloquialism for "miles per hour") from his formerly-incredible fastball the past few years, it seems like he's managed to adjust this season by improving his secondary offerings, striking out one out of every four batters (the highest of his career and good for sixth best in the AL in 2013). Even in spite of Jimenez's above-average walk-rate (10.3% relative to 7.9% for league average), he still looks like a nice find. Couple Minor Leaguer's astute observation that his Qualifying Offer rejection status makes his value to the Jays exceed his value to most other teams and you have a singing that appears to make a lot of sense.
That being said, I pointed out in the comments section that there was one potential red flag I noticed for Jimenez. In the first place, this season, Jimenez plied his trade in a pitcher-friendly park and faced relatively weak lineups (according to baseball-reference, league average pitchers facing Jimenez's opponents would score around 4.12 runs per game vs. 4.46 for league average pitchers facing R.A. Dickey's opponents). This doesn't worry me so much because there's an implicit understanding that it's harder to pitch for the Jays than almost any team in the League anyway. One thing that did concern me, however, was that, while Jimenez's K-rate (25%) was 6th in the AL, his whiff-rate (8.8%) was a much more pedestrian 27th. As whiff-rate has been shown to be closely tied to K-rate, I perceived this matter as a bit of a red flag and decided to run numbers to determine whether Jimenez would be likely to continue to outperform the strikeout-rates you'd predict based on his whiff-rates.
* * *
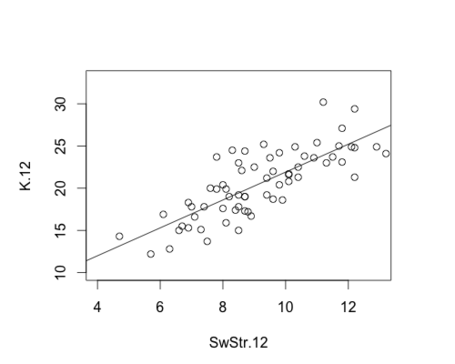
The first thing I decided to do was to predict K-rates for 2012 and 2013 based on whiff-rates. I used a sample of all starting pitchers with 150 IP in both 2012 and 2013 (65 pitchers). I used linear regression analysis based on a simple one-factor model within each season:
Predicting 2012 K-rate based on 2012 whiff-rate
F = 99.4, p < 0.0001, R**2 = 0.61
Line: 2012 K% = 1.65*(2012 whiff%) + 5.4
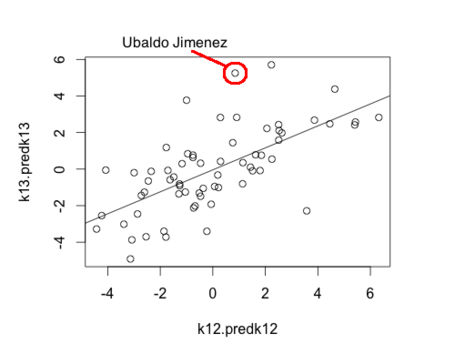
Predicting 2013 K-rate based on 2013 whiff-rate
F = 151.8, p < 0.0001, R** = 0.70
2013 K% = 1.96*(2013 whiff%) + 2.5
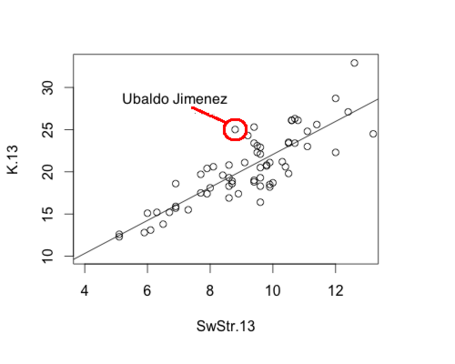
As expected, we see very similar relationships, though the slopes and intercepts are quite different. Essentially, this just means that the models predict slightly different K-rates at extremely high or low whiff-rates (in part due to Yu Darvish's very high K-rate in 2013). As the figure above illustrates, Jimenez would have predicted to strike out just 20% of batters last season, a far cry from the 25% he did strike out. In fact, the only pitcher to have a greater deviation from his predicted K-rate is the aforementioned Darvish (32.9% K-rate vs. 27.2% predicted), who lies at the extreme end of the set, where the linear relationship between whiff-rate and strikeout-rate may break.
Even at these extremes, however, the differences in prediction are actually pretty slight (e.g., at 12% whiff-rate, the 2012 model predicts a 25.2% K-rate vs. a 26.0% K-rate predicted by the 2013 model). Linear models may not be perfect here, but they do a really nice job, accounting for 60% and 70% of the variation in K-rate in 2012 and 2013, respectively.
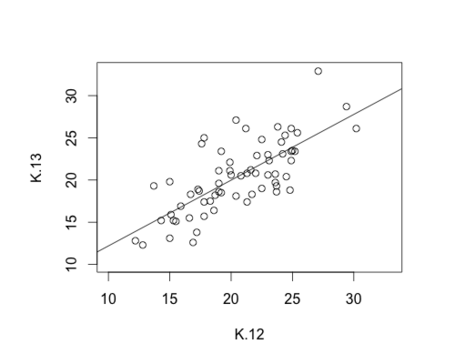
Of course, all this is pretty widely known. Make more batters swing and miss and you're likely to strike more batters out. We aren't exactly talking quantum theory here. The new question here is whether pitchers who exceeded the K-rates predicted by their whiff-rate will continue to do so. Essentially, we're asking if it's more accurate to predict 2013 K-rate based on 2012 K-rate, 2012 whiff-rate, or some sort of combination of the two.
Predicting 2013 K-rate based on 2012 K-rate
F = 75.46, p < 0.001, R**2 = 0.54
2013K% = 0.78*(2012 k%) + 4.4
Predicting 2013 K-rate based on 2012 whiff-rate
F = 36.00, p < 0.001, R**2 = 0.35
2013K% = 1.3*(2012 whiff%) + 8.1
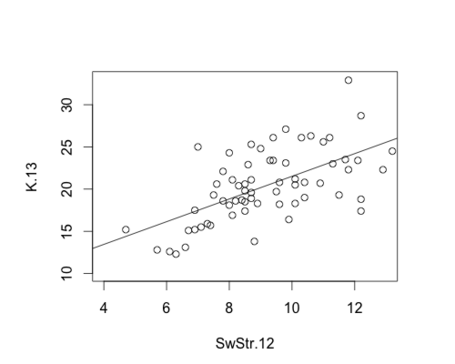
Okay. Now we're getting somewhere. So we see that 2012 K-rate predicts 2013 K-rate better than 2012 whiff-rate. Furthermore, testing these models, we see that the difference between them is significant (p < 0.001). That's a really useful piece of information because it suggests that some pitchers are actually able to strike out more batters than their whiff-rates would suggest. Now, let's dig a little deeper and look at the relationship between the deviations from predicted K-rates across the two seasons.
Predicting the difference between K-rate and predicted K-rate in 2013 based on the difference between K-rate and predicted K-rate in 2012 (positive numbers indicate striking out more batters than predicted by whiff-rate)
F = 47.32, p-value < 0.001, R**2 = 0.42
(K% - pred.K%.2013) = 0.60*(K%-pred.K%.2012) - 0.04
Models based on K-rate in 2012 predicted K-rate in 2013 no different than two-factor models based on both whiff-rate and how much the pitcher outperformed his whiff-rate (p = 0.63) but were much better than single-factor models based on either whiff-rate (F = 49.5, p < 0.001) or outperformance of whiff-rate (F = 25.0, p < 0.001).
So what's the upshot here? Well, we see some evidence that the same pitchers who struck out more batters than their whiff-rates would suggest in 2012 were able to do so in 2013, though they did regress a fair bit. Ubaldo, as an outlier, should be projected to drop off a fair bit but it doesn't look like we should be regressing him all the way back to 20% either. His K-rate only slightly exceeded what was predicted in 2012 but that was also the worst season of his career. Regressing this deviation according to the relationship we've found suggests that Ubaldo's true K-rate should be somewhere around a 23%. Of course, that's assuming that he pitches like he did in 2013. He sure didn't in 2012.
Thanks to Minor Leaguer, the R Core Development Team, and the Lucksmiths song "Midweek Midmorning", the source of today's title.